Reporting about processes
The Camunda engine automatically collects audit information about historical process or decision instances. Leverage this data by generating and displaying business relevant reports. Add business relevant phases and milestones to your process models serving as a basis for key performance indicators (KPIs).
Modeling key performance indicators (KPIs)
When modeling a process, you always add information about important key performance indicators implicitly; for example, by introducing start and end events.
Additionally, you can explicitly add the following:
Meaningful additional business milestones by modeling intermediate events, for example. This might not have any execution semantics other than leaving a trace in the history of the workflow engine. The milestone is met as soon as the process has passed the event. Its status can therefore be passed or not passed.
Meaningful business phases by modeling things like (embedded) subprocesses. In contrast to a milestone, a phase's state can be not entered, currently active, or passed.
Consider the following example - a "Tweet Approval Process" shows start and end events as well as milestones:
"3After one business day, the reviewer is reminded to speed up - and such reviews are internally marked by passing the end event 'Review done slowly'.
4Approved tweets will pass the additional intermediate event. The cycle time up until that point is automatically captured too.
5Furthermore, when tweets are successfully published, we are interested in the ratio of those tweets...
6...when compared to tweets that do not get published. Therefore, we model two different end events representing those two business end states of the process.
Duplicate tweets will not be published even though they have been approved before. The more precisely we describe and name the business semantics of events, the better our KPI's will reflect the reality we want to measure!
When you do not (only) want to concentrate on milestones, but phases in your process, model the phases as subprocesses:
1The phase Review—modeled with a subprocess—will be active, while the human reviewer will need to find time to complete the task...
2...whereas the phase Publication will be completed automatically - hence process instances "remaining" there for longer than a few seconds will probably indicate ongoing problems with the uptime and reachability of the used services.
History architecture
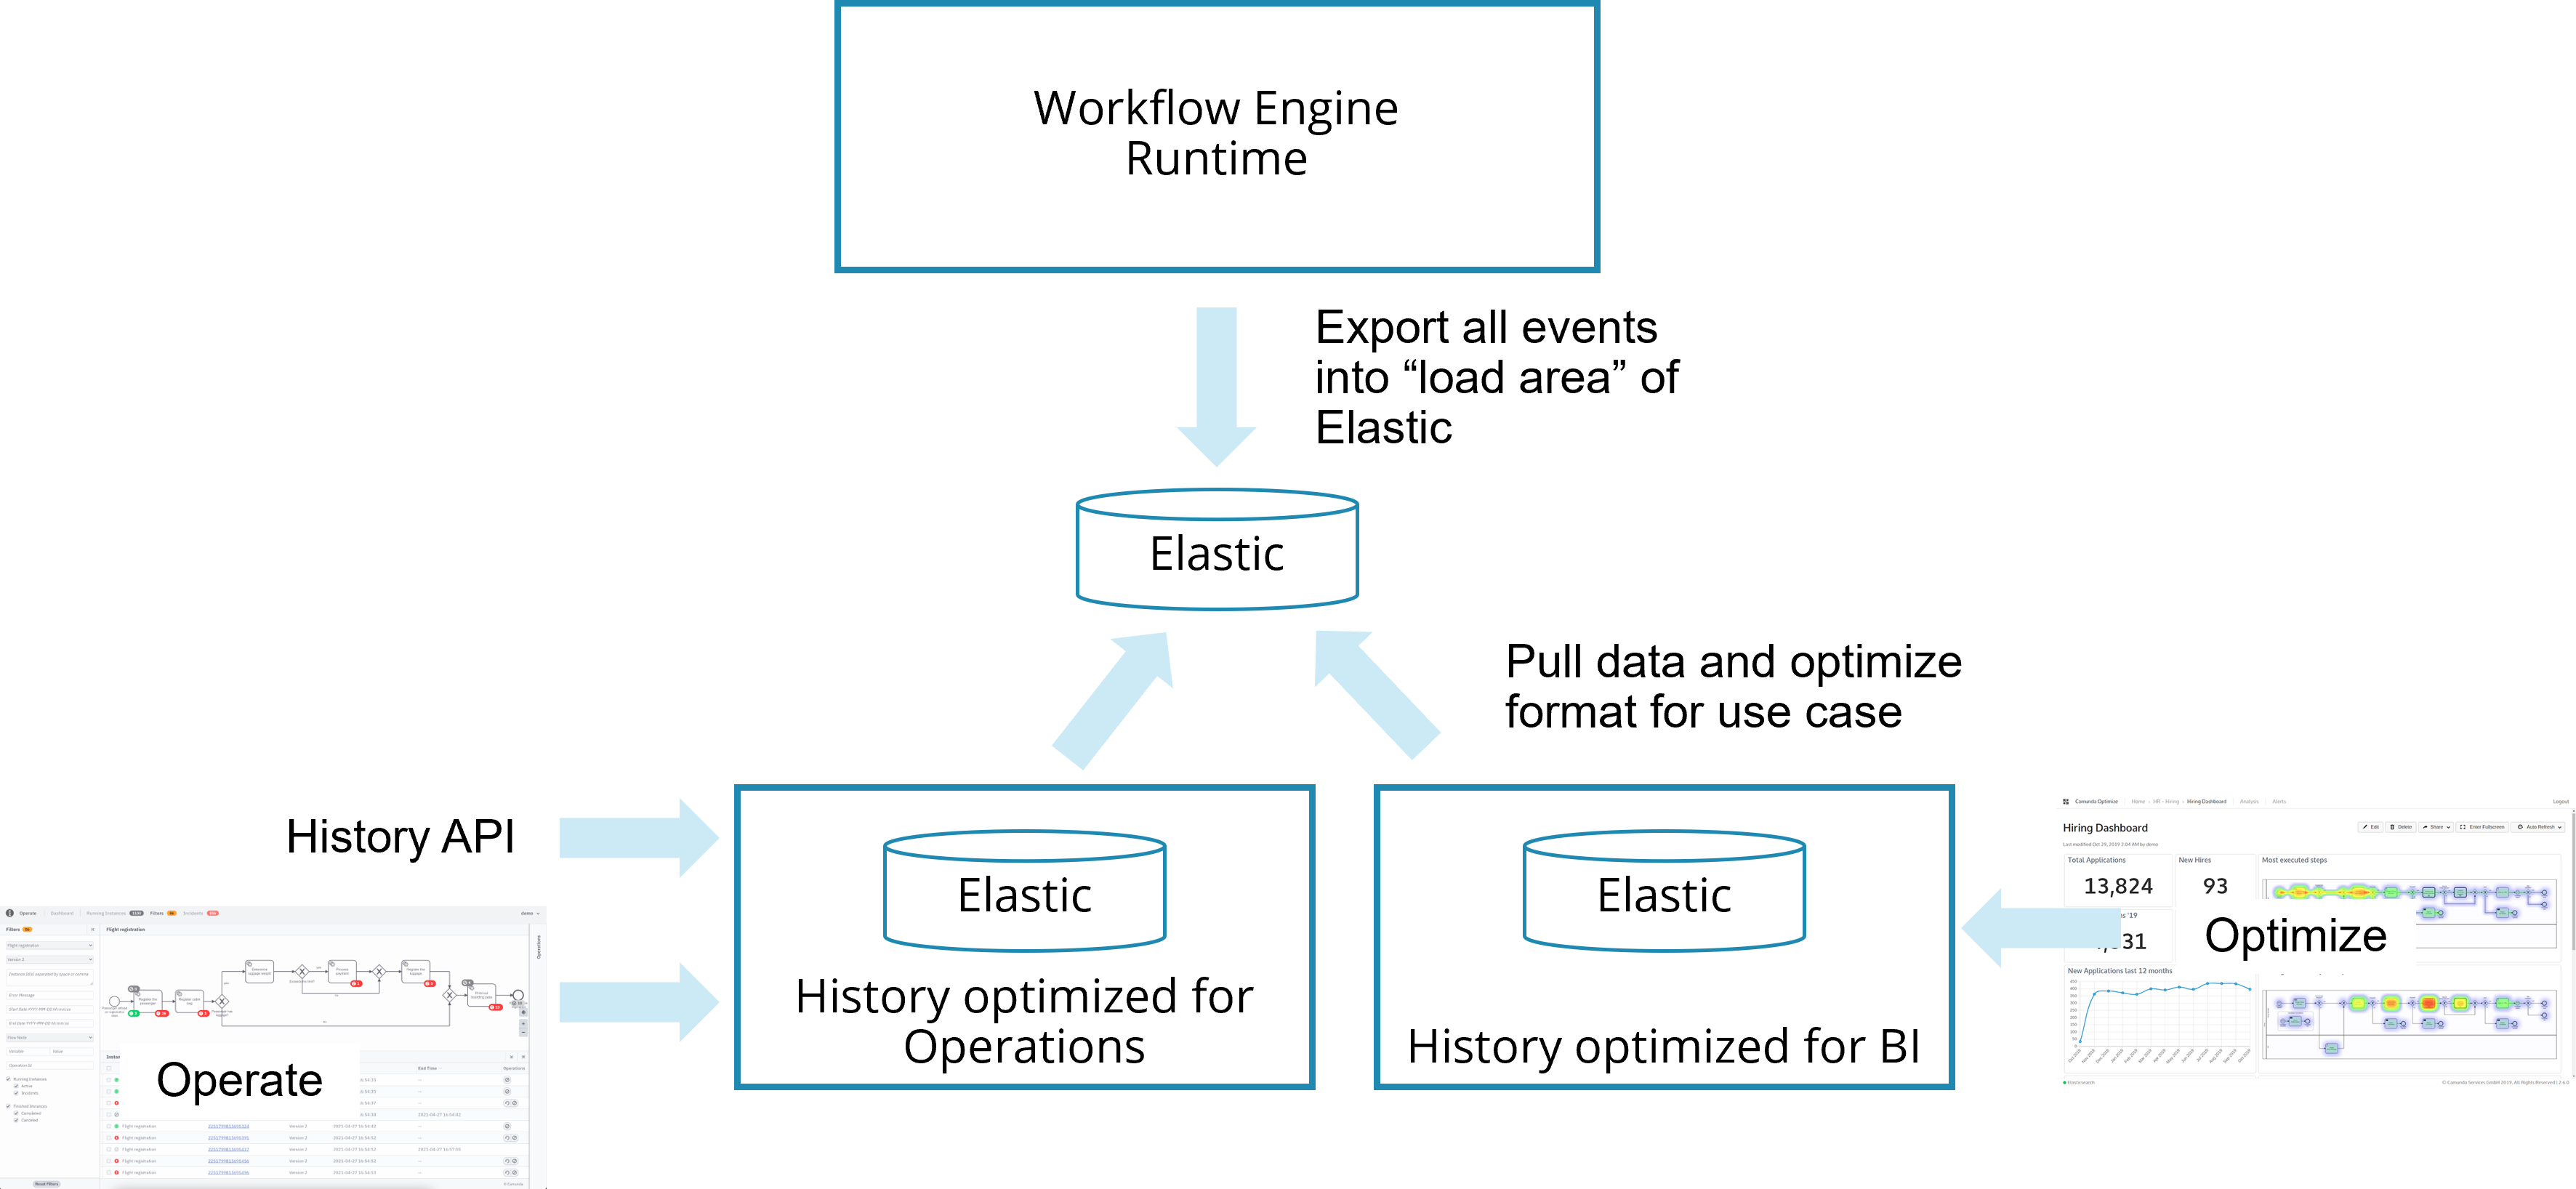
It is useful to understand the architecture around history data in Camunda 8.
Note that the history architecture is very different in Camunda 7.x, see Camunda 7 User Guide.

Camunda saves historical data not just when a process instance finishes, but on the go, while a process instance is active. By doing this, Camunda separates runtime data from history data. A growing history will not influence the runtime behavior, and you should never need to access runtime data for reporting purposes.
Historical data can be leveraged via three possible mechanisms:
Camunda tools: Leverage Camunda Operate or Camunda Optimize. This is a very simple approach that works out-of-the-box and should satisfy many requirements already. Camunda Operate focuses on operational use cases ("Where is my process? Why did this fail?") whereas Camunda Optimize provides business intelligence about your processes. Optimize allows you to build reports and dashboards including setting alerts for thresholds.
Query API: Using the public API (currently under development), this has the advantage that you can make use of the history data within your own applications.
Pushing events: Pushing Camunda events by using exporters. Note that you can only add own exporters in a Self-Managed setting, not in Camunda 8 SaaS. Exporters have the advantage that you can push the data into any infrastructure you have, and possibly even filter or enrich the data in that step.
Connecting custom business intelligence systems (BI), data warehouses (DWH), or monitoring solutions
You might move data from the Camunda History to a decoupled system like a Business Intelligence (BI) solution, a Data Warehouse (DWH), some Data Lake, or an own monitoring solution, for example based on Prometheus.
Leveraging typical BI system's ETL (extract, transform, and load) features allows you to optimize data structure for your reporting purposes (to speed up report generation) or to combine generic process engine data with business entities (to allow for more in-depth analysis).
To get the data into the BI system, leverage one of the mechanisms described above. Our recommendation generally is:
- In SaaS, leverage the history API to regularly pull data, as custom exporters are not supported there.