Metrics
When operating a distributed system like Zeebe, it is important to put proper monitoring in place. To facilitate this, Zeebe exposes an extensive set of metrics.
Zeebe exposes metrics over an embedded HTTP server.
Types of metrics
- Counters: a time series that records a growing count of some unit. Examples: number of bytes transmitted over the network, number of workflow instances started
- Gauges: a time series that records the current size of some unit. Examples: number of currently open client connections, current number of partitions
Metrics format
Zeebe exposes metrics directly in Prometheus text format. The details of the format can be read in the Prometheus documentation.
Example:
# HELP zeebe_stream_processor_events_total Number of events processed by stream processor
# TYPE zeebe_stream_processor_events_total counter
zeebe_stream_processor_events_total{action="written",partition="1",} 20320.0
zeebe_stream_processor_events_total{action="processed",partition="1",} 20320.0
zeebe_stream_processor_events_total{action="skipped",partition="1",} 2153.0
Configuring metrics
The HTTP server to export the metrics can be configured in the configuration file.
Connecting Prometheus
As explained, Zeebe exposes the metrics over a HTTP server. The default port is 9600.
Add the following entry to your prometheus.yml:
- job_name: zeebe
  scrape_interval: 15s
  metrics_path: /metrics
  scheme: http
  static_configs:
  - targets:
    - localhost: 9600
Available metrics
All Zeebe related metrics have a zeebe_-prefix.
Most metrics have the following common label:
partition: cluster-unique id of the partition
Metrics related to workflow processing:
zeebe_stream_processor_events_total: The number of events processed by the stream processor. Theactionlabel separates processed, skipped and written events.zeebe_exporter_events_total: The number of events processed by the exporter processor. Theactionlabel separates exported and skipped events.zeebe_element_instance_events_total: The number of occurred workflow element instance events. Theactionlabel separates the number of activated, completed and terminated elements. Thetypelabel separates different BPMN element types.zeebe_running_workflow_instances_total: The number of currently running workflow instances, i.e. not completed or terminated.zeebe_job_events_total: The number of job events. Theactionlabel separates the number of created, activated, timed out, completed, failed and canceled jobs.zeebe_pending_jobs_total: The number of currently pending jobs, i.e. not completed or terminated.zeebe_incident_events_total: The number of incident events. Theactionlabel separates the number of created and resolved incident events.zeebe_pending_incidents_total: The number of currently pending incident, i.e. not resolved.
Metrics related to performance:
Zeebe has a back-pressure mechanism by which it rejects requests, when it receives more requests than it can handle with out incurring high processing latency. The following metrics can be used to monitor back-pressure and processing latency of the commands.
zeebe_dropped_request_count_total: The number of user requests rejected by the broker due to backpressure.zeebe_backpressure_requests_limit: The limit for the number of inflight requests used for backpressure.zeebe_stream_processor_latency_bucket: The processing latency for commands and event.
Metrics related to health:
The health of partitions in a broker can be monitored by the metric zeebe_health.
Grafana
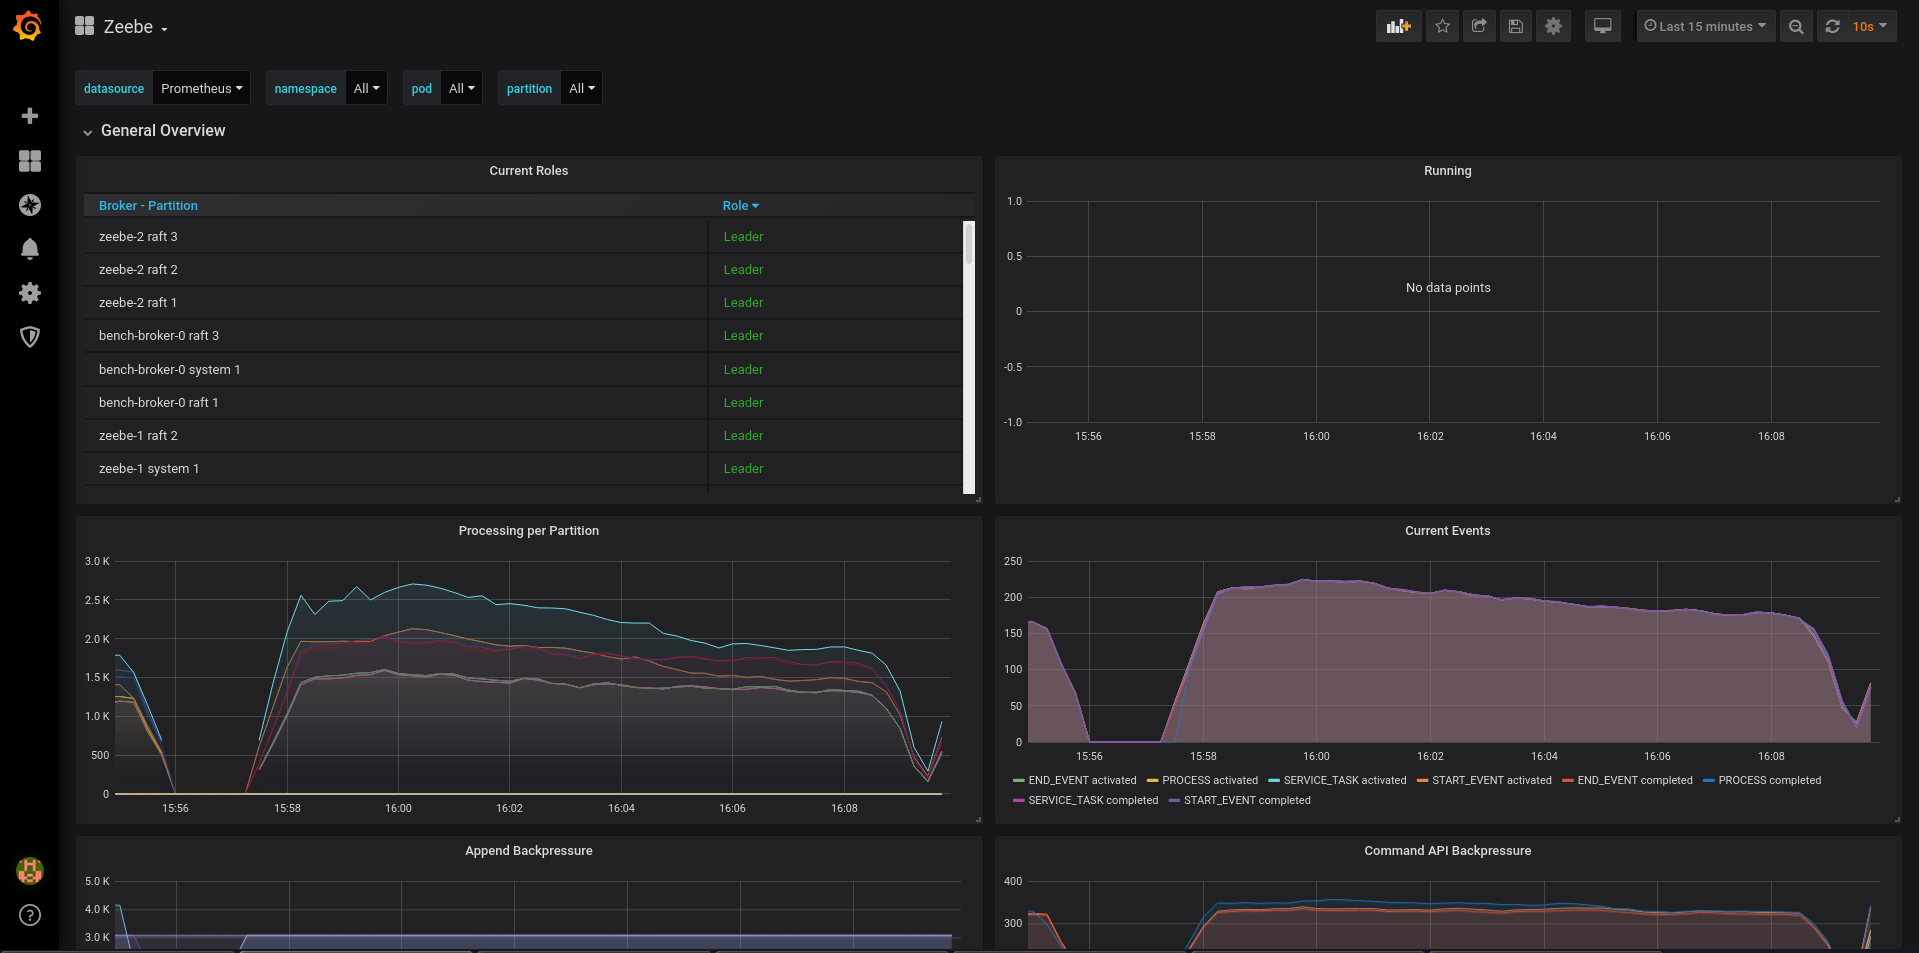
Zeebe comes with a pre-built dashboard, available in the repository: monitor/grafana/zeebe.json
Import it into your Grafana instance, then select the correct Prometheus data source (important if you have more than one), and you should be greeted with the following dashboard:
